2. Fit Builder example
Here we will show an example of combining already existing fitting functions with the FunctionBuilder. Suppose we have data following: $$ f(x) = m\cdot x + n + A\cdot exp\left({\frac{(x-m)^2}{2s^2}}\right) + \xi $$ Where \(\xi\) is some random noise. And we are interested in knowing the value of \(m\): the gaussian center.
import numpy as np

def gauss(x, A, x0, sigma):
    return A * np.exp(-(x - x0) ** 2 / (2 * sigma ** 2))

def dataFunction(x, m, n, A, x0, sigma):
    return m*x + n + gauss(x, A ,x0, sigma)

noise = np.random.normal(size=200)

xdata = np.arange(200)
ydata = dataFunction(xdata, -0.04, 5, np.random.random()
                     * 30, np.random.random()*200, 15) + noise
This function is a linear combination of linear and gaussian functions therefore if we only fit a gaussian the result could be bias due to the linear background. Lets then create a function that has that background in its definition:
Gaussian + Linear. All default operations (+, -, *, /, **, % and //) are supported between already created functions. Also chaining operations with brackets is supported, just as regular numbers!
Once we add the custom function to the Fitter a new tool will appear with the new function just defined.
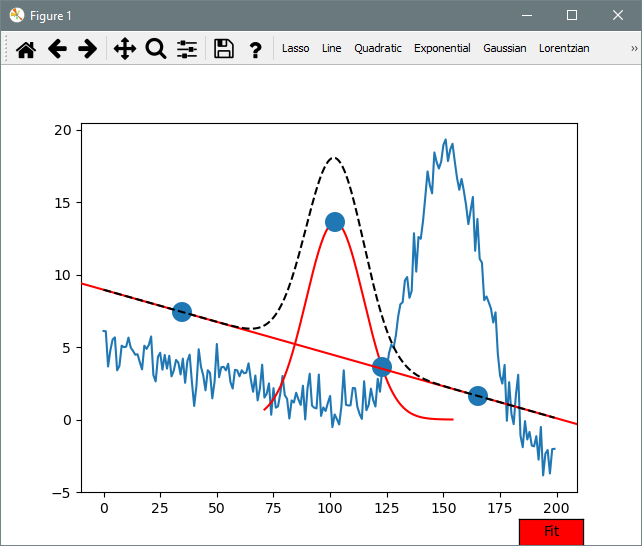
Now move those points until the black dashed line is close to the desired result.