4. Filter example
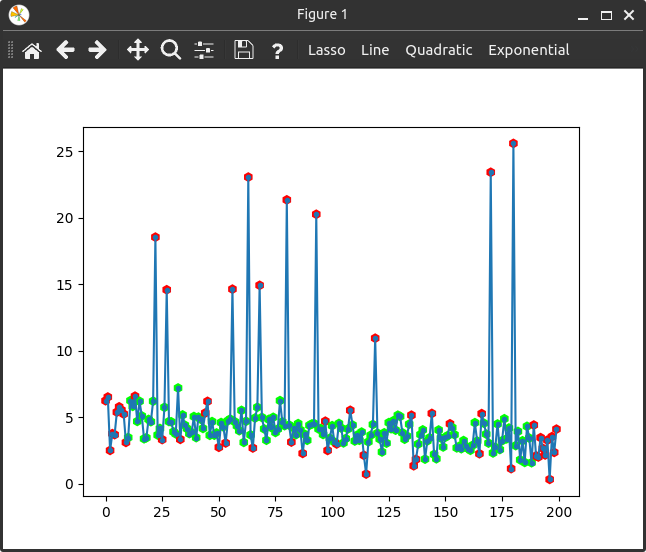
Lets use a filter to select our data. We will use the same data generation as the first example, with some points with extra noise. The objective is to filter them using a sliding window and percentiles.
import numpy as np
import matplotlib.pyplot as plt
import itfit

def dataFunction(x, m, n):
    return m*x + n

noise = np.random.normal(size=200)

# Extra noisy points!
for _ in range(10):
    ind = np.random.randint(0, 200)
    noise[ind] = np.random.random()*20+5

xdata = np.arange(200)
ydata = dataFunction(xdata, -2/200, 5) + noise
Now we create a filter. Itfit can use filters that accept 2 arguments and return a boolean (or array of booleans). In this example we use a sliding window and percentiles to select the points that are between percentiles 95 and 5.
def my_filter(x, y) -> list[bool]:
    selection = np.zeros(x.shape, dtype=bool)
    window_size = 21
    selection[:window_size//2] = False
    selection[-(window_size//2 + 1):] = False

    for i, window in enumerate(np.lib.stride_tricks.sliding_window_view(y, window_size)):
        p95 = np.percentile(window, 95)
        p05 = np.percentile(window, 5)

        selection[window_size//2 + i] = True if p05 < window[window_size//2] < p95 else False

    return selection
Now we call the Fitter and fit the data to the line predefined function.
fitter = itfit.Fitter(xdata, ydata)
fitter.add_filter(my_filter)
fitter()
plt.show()

plot.save_fig("noisy_friend.png")